Welcome to our comprehensive exploration of Match.com, a trailblazer in the online dating world. In this detailed report, we dive into the intriguing statistics of Match.com, a key player in the dating industry, revealing insights about user demographics, the platform’s financial performance, and much more. Whether you’re interested in the business aspect of Match Group, Match.com’s parent company, or the evolving trends among its user base, this article provides a clear, easy-to-understand overview of the data.
Here’s what you can find in this article:
Key statistics
Financials:
- Match Group’s Revenue was $3.3 billion in 2023
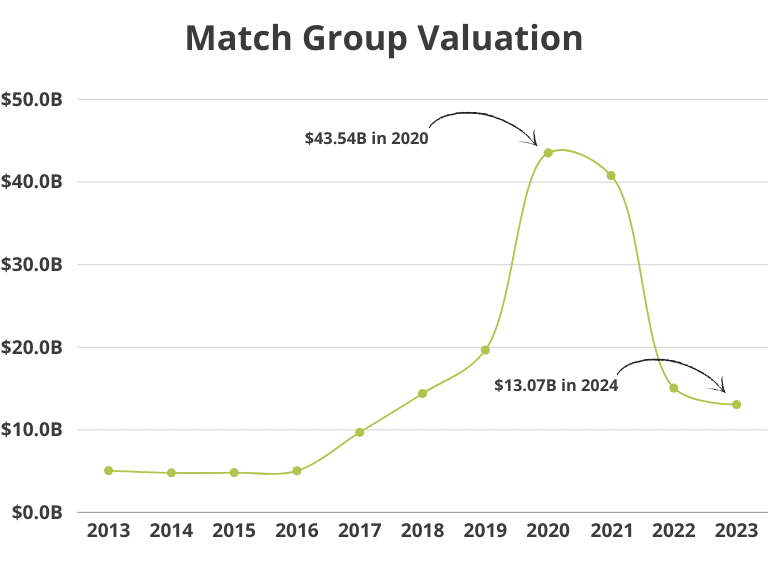
- Match Group’s Valuation was $13.07 billion in 2023
- Match Group’s Net Income was 652 million in 2023
Users:
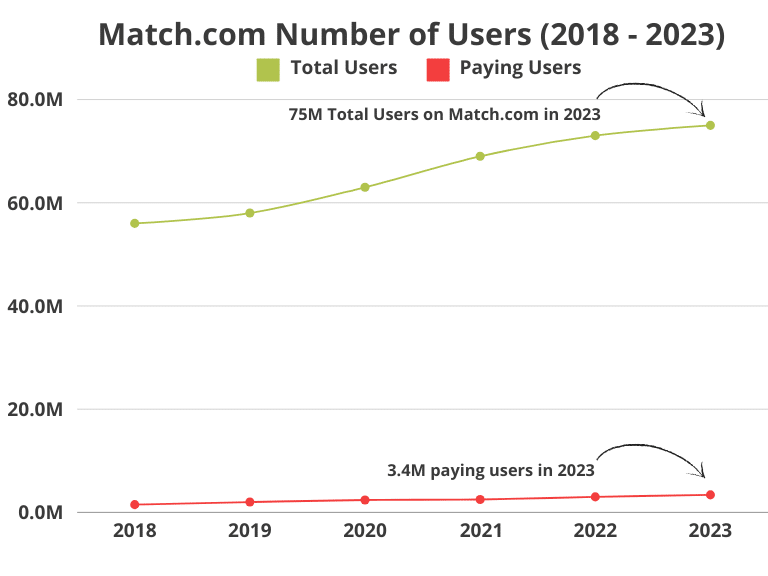
- Match.com had 75 million total users whereas 3.4 million were paying users in 2023
- 45% of Match.com users are women, indicating a majority of male users on the platform.
Match Rates:
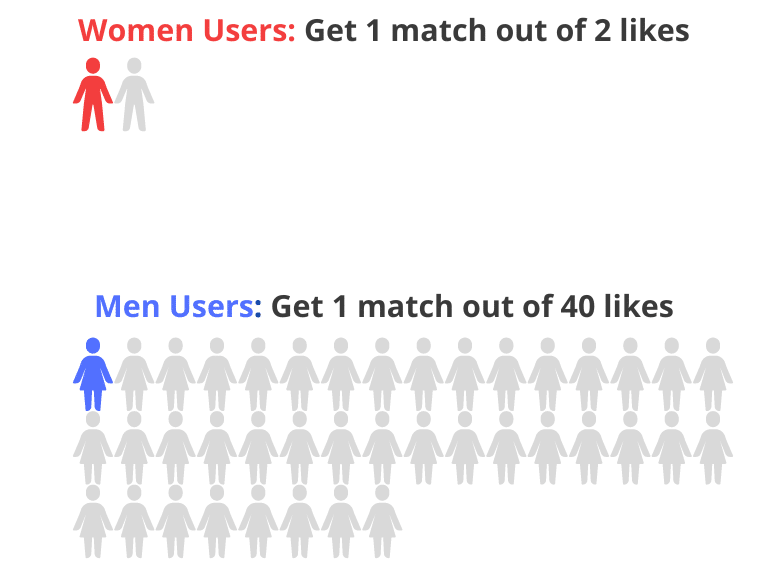
- Men’s Matches: 1 match per 40 likes.
- Daily Matches: 52% of men have less than 1 match/day.
- Weekly Matches: 13% of men have less than 1 match/week.
- Men’s Likes: Like 1 in 3 profiles.
- Women’s Matches: 1 match per 2 likes.
- Women’s Likes: Like 1 in 16 profiles.
Fun Fact:
- 1 out of 10 use it primarily for hookups
Match Group Financials
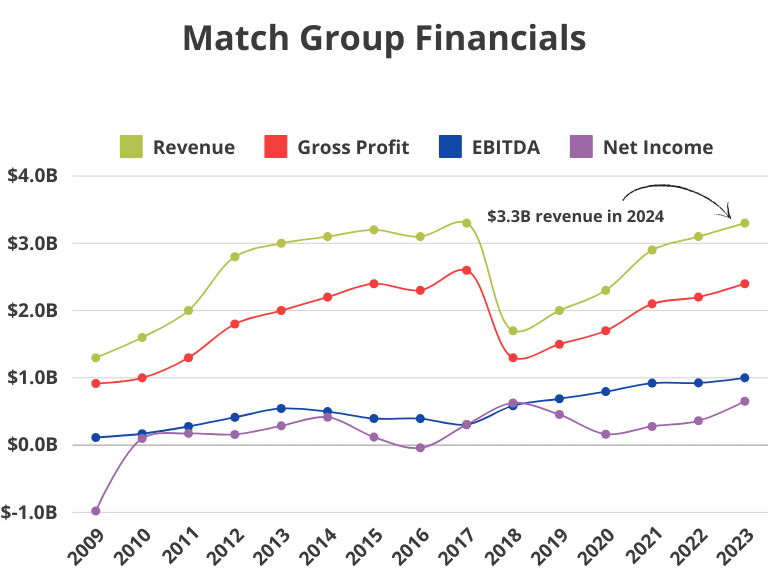
- Revenue Growth: The table shows a general upward trend in total revenue over the years. Starting from $1.347B in 2009, the revenue almost tripled to $3.3B by 2023. This indicates consistent growth and expansion of Match Group’s market presence.
- Profitability Trends:
- Gross Profit: Mirroring revenue, gross profit has also increased substantially from $917M in 2009 to $2.410B in 2023. This suggests that Match Group has not only been increasing its revenue but also maintaining or improving its profit margins over time.
- Net Income: There’s significant variability in net income. After a considerable loss in 2009 (-$979M), the company rebounded and showed profitability most years, peaking at $627M in 2018. However, there’s a notable fluctuation between years, such as a dip in 2016 (-$41M).
- EBITDA (Earnings Before Interest, Taxes, Depreciation, and Amortization): This metric shows a generally increasing trend, indicating improving operational efficiency and profitability. From $113M in 2009, it reached $1.0B by 2023.
- Valuation Fluctuations: The company’s valuation experienced significant fluctuations. Notably, in 2021 and 2020, the valuation was highest at over $40B, despite the total revenue being lower than in 2023. Despite increased revenues and net income, the drop in valuation from 2021 to 2023 could be influenced by external market conditions or changes in investor sentiment.
- Year-to-Year Comparison: Between 2022 and 2023, there’s a noticeable increase in all financial aspects except valuation, which decreased from $15.07B to $13.07B. This may indicate a market correction or other external factors affecting the stock market perception of Match Group.
- Anomalous Year (2017): The year 2017 shows unusually high figures for total revenue and gross profit compared to its adjacent years. This might be due to specific acquisitions, expansions, or one-time events that significantly boosted financial performance for that year.
Overall, Match Group’s financial history reflects a strong market presence with growing revenue and profitability, though impacted by market variances and occasional fluctuations in net income and valuation. They are in other words the largest dating conglomerate in the world.
| Year | Revenue | Gross profit | EBITDA | Net Income | Valuation |
|---|---|---|---|---|---|
| 2023 | $3.3B | $2.4B | $1.0B | $652M | $13.07B |
| 2022 | $3.1B | $2.2B | $925M | $362M | $15.07B |
| 2021 | $2.9B | $2.1B | $922M | $278M | $40.81B |
| 2020 | $2.3B | $1.7B | $795M | $162M | $43.54B |
| 2019 | $2.0B | $1.5B | $689M | $454M | $19.67B |
| 2018 | $1.7B | $1.3B | $586M | $627M | $14.39B |
| 2017 | $3.3B | $2.6B | $305M | $305M | $9.71B |
| 2016 | $3.1B | $2.3B | $394M | $-41M | $5.04B |
| 2015 | $3.2B | $2.4B | $396M | $119M | $4.82B |
| 2014 | $3.1B | $2.2B | $498M | $415M | $4.79B |
| 2013 | $3.0B | $2.0B | $545M | $286M | $5.06B |
| 2012 | $2.8B | $1.8B | $412M | $159M | – |
| 2011 | $2.0B | $1.3B | $277M | $174M | – |
| 2010 | $1.6B | $1.0B | $169M | $99M | – |
| 2009 | $1.3B | $917M | $113M | $-979M | – |
Match.com Users
67.7% have at some point tried an online dating service and a lot of those users have visited Match.com – since this huge brand has been around for a lot of years.
The most important aspect of looking at the users at Match.com is looking at the active user base. We defined this as all the users on Match.com, who have been active on the dating site or app during the past 30 days.
This group has certain demographic characteristics that were mapped out to the following:
- Most users on Match.com are men, and only 45% of Match.com users are women (on Tinder 65% of the US users are males).
- Most users on Match.com are between 30 and 49 years old (45%).
- 82% of users on Match.com are over 30 years old.
- 41% of users on Match.com only have a high school degree, while 50% have a college degree, and around 9% have a graduate degree.
| Active Users on Match.com, Demographics | % |
|---|---|
| Gender: Women | 44.7% |
| Age: 18-29 | 18.1% |
| Age: 30-49 | 44.8% |
| Age: 50+ | 37.1% |
| Children: Parent | 59.3% |
| Education: High school degree | 41.1% |
| Education: College degree | 50.2% |
| Education: Graduate degree | 8.7% |
| Race: Caucasian (white) | 77.4% |
| Race: Hispanic/Latino | 9.1% |
| Race: African American | 9.3% |
| Race: Asian | 4.2% |
| Region: West | 25.3% |
| Region: Midwest | 25.5% |
| Region: South | 36.7% |
| Region: Northeast | 12.5% |
| Smoking: Non-smokers | 67.5% |
Match.com Number of Users (2018-2023)
The website match.com had 75M total users in 2023, whereas 3.4M of them were paying users.
See the development from 2018 to 2023 in the image below.
Daily Engagement
- The average user on Match.com engages with the platform 3.2 times per day.
- Compared to Tinder, this is fairly high, the average Tinder user uses the platform 3.9 times per day.
The percentage of users that engage daily is another data point frequently used to measure how popular a dating platform/app is.
- 50.5% of users on Match.com engage daily with the platform or their app.
- 55.4% of users on Tinder engage daily with the app.
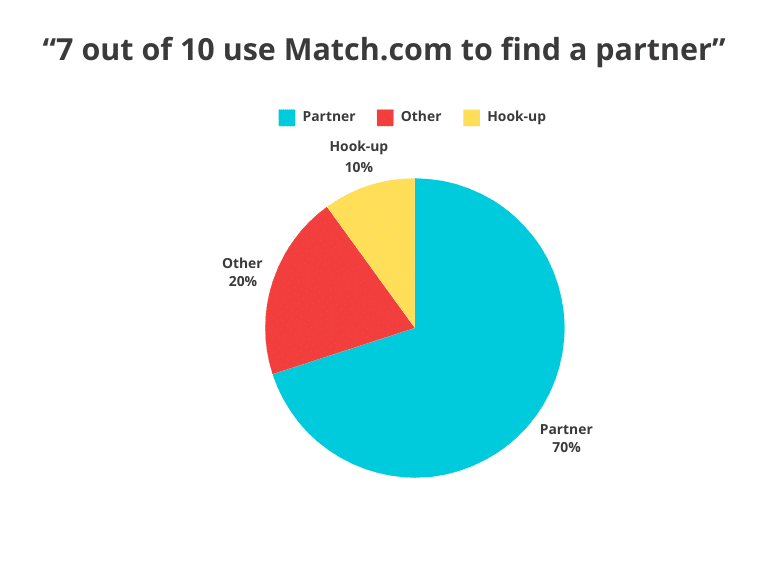
Why do people use Match.com?
- 7 out of 10 uses it primarily to find a partner
- 2 out of 10 use it primarily for “other things”
- 1 out of 10 use it primarily for hookups
Match Rates
The dynamics of matchmaking in online dating platforms present a stark contrast when comparing the experiences of men and women, as evidenced by recent data from roast.dating. This data offers a fascinating glimpse into the behavioral patterns and success rates of different genders on these platforms.
Men’s Match Rate: The data suggests that men face a significantly lower match rate compared to women. On average, men receive one match for every 40 likes they send. This implies that the majority of men’s efforts to connect do not yield immediate results. Moreover, 52% of men receive less than one match per day, highlighting a daily struggle to find mutual interest. The scenario is even more pronounced for 13% of men who get less than one match per week, pointing towards a highly competitive environment.
Women’s Match Rate: In stark contrast, women experience a higher match rate. On average, women receive a match for every two likes, indicating a higher selectivity and success rate in the matching process. This is further supported by the fact that women, on average, like only one out of 16 profiles. This selective approach could be indicative of a more cautious or discerning strategy in swiping.
Behavioral Differences: The underlying behavioral patterns also differ significantly between the genders. While men tend to like one out of every three profiles, suggesting a less selective approach, women are more discerning, liking only one in sixteen. This disparity not only affects match rates but also shapes the overall user experience and expectations on the platform.
Implications for Online Dating Dynamics: These statistics shed light on the vastly different experiences and strategies of men and women in the online dating world. The lower match rate for men might be reflective of a higher competition and less selective swiping, whereas women’s higher match rate aligns with a more selective approach. This disparity in match rates could influence user satisfaction, engagement, and perceptions of the platform’s effectiveness.
In conclusion, understanding these match rates is crucial for both users and platforms, as it informs expectations and guides improvements in the matchmaking algorithms. For users, this data offers valuable insights into the dynamics at play, aiding in setting realistic expectations and strategies in their online dating endeavors.
Match Group Company Overview
In the following, we walk through the facts of the business behind Match.com.
C-level executives
- Bernard Jin Kim (45) – Director and Chief Executive Officer.
- Gary Swidler (51) – President and Chief Financial Officer.
- Jared F. Sine (43) – Chief Business Affairs and Legal Officer and Secretary.
- Philip D. Eigenmann (51) – Chief Accounting Officer.
Other facts
- Founding: Match.com was founded in 1993 by Gary Kremen and Peng T. Ong, and it was launched on April 21, 1995.
- Ownership: The platform is owned by Match Group Inc., which also owns other popular dating services like Tinder, OkCupid, and PlentyOfFish.
- Headquarters: Match.com is based in Dallas, Texas, United States.
- Available languages: The website is available in multiple languages, including English, French, German, Spanish, Portuguese, and more.
- Global presence: Match.com operates in more than 50 countries and is available in 12 languages.
- Marriages: Match.com has been responsible for thousands of marriages. According to a study conducted in 2013, 17% of US marriages that occurred between 2005 and 2012 began on an online dating site, with Match.com responsible for nearly 25% of those marriages.
- LGBTQ+ friendly: Match.com is inclusive of the LGBTQ+ community and allows users to specify their sexual orientation and gender identity on their profiles.
- Subscription model: Match.com offers both free and paid subscriptions. Free users have limited access to features, while premium users can send and receive messages, view who has viewed their profile, and access other premium features.
- Success rate: Match.com claims to be responsible for more dates, relationships, and marriages than any other dating site.Mobile app: Match.com has a mobile app available for iOS and Android devices.
Sources: Macrotrends.net and roast.dating