They say love is a beautiful thing. Humans want to love and be loved back. But does everyone find love? Unfortunately, some people do not experience love from a partner and, therefore end up single.
At the Bedbible Research Center, we have carried out intensive research to cover this topic even more. Find out how many people are single worldwide, how many die as singles, why people are not interested in a date, and much more.
Here’s what you can find in this piece:
- Here Is The Number of Single People In The World
- 10 Countries With The Most Singles
- Focusing On The US
- How Many Are Looking For A Date
- Why Are People Single
- Fun Facts About Single People
- Why Do We See More Singles
Key Findings
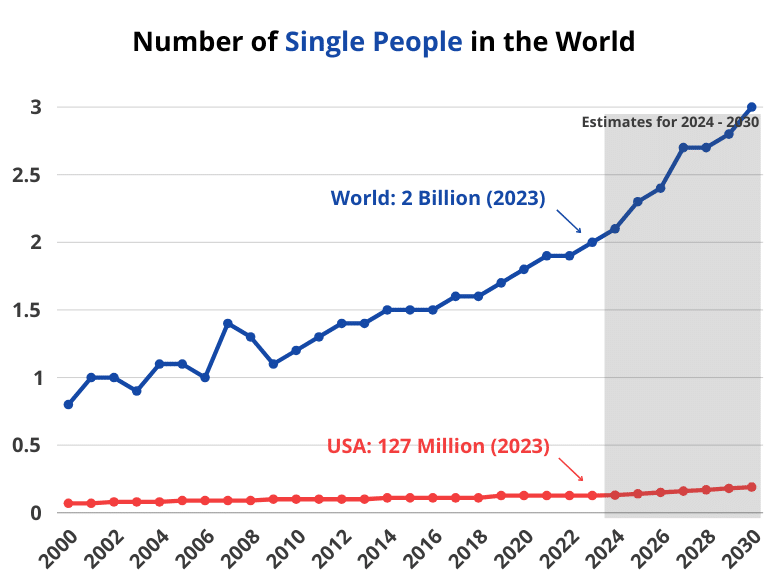
- More than 2 billion people worldwide are currently single.
- 127 million adults are single in the USA (38,4% of the population is single).
- 89% of singles are not dating because they think they cannot flirt well.
- 75% of singles who are not dating are too picky.
- 82.1% of single women believe being too picky is why they are not dating.
- 34% of high school graduates in the United States are single.
- Approx. 15 Mio. Americans die single every year.
- 41% of single Americans are aged between 18-29 years making up the highest age group of singles in the U.S.
- Denmark has the highest number of singles with 24.1% of adults in the country being single.
- Richmond, VA is the city with the most singles in the U.S.
- Most singles in the U.S. are Black Americans, constituting 47%, followed by White/Caucasian at 28% and Hispanic origin at 27%.
- Most singles are not dating because they have important priorities or like staying single.
- 66.93% of single adults in America have never been married.
- 53% of singles on the dating market are looking for either casual dates or long-term relationship
Here Is The Number of Single People In The World
- The world has at least 2 billion single people.
- 13.4% of people in the United States are Single.
- In 2023, 49.29% of people in Denmark were single.
- In 2018, 200 million adults in China were single.
- As of 2018, France had 27.7 million single people.
- Iceland had 90,239 singles in 2023.
- In 2023, 5,910,276 adults in Belgium were unmarried singles.
- As of 2022, 30.7 million people in South Africa were single, representing 51.85%.
- In 2023, 8,851,656 adults in the Netherlands were single.
- As of 2020, Wales and England had 28,392,544 singles.
- 34.8 million adults in Russia were single in 2012.
- The United States had 126.9 million single adults in 2021.
- In 2022, Canada had 18.27 million single adults.
- As of 2022, 5,656,900 individuals were single in Sweden.
10 Countries With The Most Singles (compared to the total number of citizens)
In today’s fast-paced world, the dynamics of relationships and marital status are changing rapidly across the globe. As we explore this evolving landscape, a fascinating trend emerges: certain countries are experiencing a significant rise in the number of single individuals. This phenomenon is not confined to one region or culture but is a global occurrence, reflective of changing societal norms and individual choices.
In our latest analysis, we delve into the statistics to uncover the countries with the highest percentages of single people. From the cozy streets of Denmark to the vibrant cities of France, our list traverses diverse cultures and geographies. These nations, each unique in its way, share a common thread – a notable portion of their populations are embracing the single life. Whether due to shifting social attitudes, economic factors, or personal preferences, these countries are redefining what it means to be single in the modern world.
Here’s a glance at the countries leading this intriguing trend:
| Country | Percentage |
|---|---|
| Denmark | 24.1% |
| France | 22.8% |
| Finland | 19.6% |
| Belgium | 19.5% |
| Norway | 19.3% |
| Luxembourg | 19.1% |
| Australia | 18.5% |
| Estonia | 18.2% |
| New Zealand | 17.6% |
| Switzerland | 17.5% |
Source: iusw.org
Singles in the USA
In an era where personal choices and societal norms are constantly evolving, the concept of being single in the United States presents a multifaceted and intriguing picture. Our comprehensive report titled ‘Focusing on the US’ dives deep into the landscape of singleness across various dimensions in the country. We explore not just the overall number of single individuals, but also examine this trend through the lenses of geography, demography, and sociology.
How Many Are Single In The US
- In 2005, more than 55% of Americans Were Single, with 42% being single men.
- 65% of women In America were single as of 2006.
- In 2016, 111 million adults in the U.S. were single with 53% being women and 47% being men.
- In 2019,31% of adults in the U.S. were single, with more than half searching for dates online.
- As of 2020, 89,028, 650 Americans were single, of which 47,510,290 were males while 41,518,250 were females.
- In 2021, 127 million Americans (51%) were single.
- 127 million American adults were single, accounting for about 40% of the country’s population.
Cities With The Most Singles
Ever wonder where in the United States you’re most likely to meet single people? Our latest section focuses on this, showcasing the top cities where single men and women live. We’ve ranked these cities, giving you a clear picture of where singles are thriving in the US.
Take a look at our list:
| Rank | Top 10 Cities With Most Single Men | Top 10 Cities With Most Single Women |
|---|---|---|
| 1 | Minneapolis,MN | Richmond, VA |
| 2 | Minneapolis, MN | Pittsburgh, PA |
| 3 | Atlanta, GA | Cincinnati, OH |
| 4 | Newark, NJ | Cleveland, OH |
| 5 | Pittsburgh, PA | Newark, NJ |
| 6 | Madison, WI | Baton Rouge, LA |
| 7 | Richmond, VA | Atlanta, GA |
| 8 | Buffalo, NY | Washington DC |
| 9 | Reno, NY | St.Louis, MO |
| 10 | Cinicinnati, OH | Buffalo, NY |
How Many Americans Die Single?
- In the United States, singles have a higher death rate than married people.
| Marital status | Death Rate in 2010 (per 100,000) | Death Rate in 2019 (per 100,000) |
|---|---|---|
| All Americans | 1,122 | 1,074 |
| Married | 839 | 747 |
| Never Married | 1,466 | 1,423 |
| Widowed | 1,567 | 1,627 |
| Divorced | 1,366 | 1,324 |
To estimate the number of Americans who die single, we need to focus on the death rates for “Never Married,” “Widowed,” and “Divorced” individuals, as these categories represent people who are single at the time of death. The “Widowed” and “Divorced” categories are a bit more complex since these individuals were once married, but for this calculation, we’ll include them as ‘single at the time of death.’
Based on the given death rates per 100,000 individuals for 2019:
- Never Married: 1,423 deaths per 100,000
- Widowed: 1,627 deaths per 100,000
- Divorced: 1,324 deaths per 100,000
Let’s calculate the estimated number of deaths for each category based on the US population of 335 million.
The formula to calculate the number of deaths is:
Number of Deaths = ((Death Rate per 100,000/100,000)×Total Population)
We will sum the deaths from the three categories to estimate the total number of single Americans who die each year. Let’s calculate this.
Based on the death rates and the US population, it’s estimated that approximately 14,652,900 single Americans (including never-married, widowed, and divorced individuals) died in 2019. This figure provides a comprehensive view of the number of individuals who were single at the time of their death in that year.
By Ethnicity
- About 47% of singles in the U.S. are Black/African Americans, hence representing the highest number of single adults in the country.
- 28% of singles in the U.S. are White or Caucasian.
- 27% of Singles in the U.S. are of Hispanic origin.
| Ethnicity | % of Singles |
|---|---|
| Black/African Americans | 47% |
| White/Caucasian | 28% |
| Hispanic | 27% |
By Marital Status
- 66.93% of single adults in America have never entered a marriage institution. That makes up a total of about 89,028, 651 people representing the largest portion of single Americans.
- 21.62% of single Americans are divorced. That is about 15,230,473 people who have divorced.
- Approximately 11.45% of single adults in the U.S., which is roughly 15,230,473 people have lost their because of death.
| Marital Status | % of Singles |
|---|---|
| Never Married | 66.93% |
| Divorced | 21.62% |
| Widowed | 11.45% |
By Age
- 41% of single Americans are aged between 18-29 years, representing a huge number of young adults who are independent or on dating apps trying to find a partner.
- 23% of single Americans are in the 31-49 age group. A significant number of adults in this group are married or have long-term partners.
- 28% of singles in the U.S. are in the 50-64 age group. Most of the singles are either divorced or lost their partners due to death.
- 36 % of single Americans are aged 65 years and above. In this group, you will find seniors who have made up their minds to remain single because of life circumstances or personal choices.
| Age Group | % Singles |
|---|---|
| 18-29 | 41% |
| 30-49 | 23% |
| 50-64 | 28% |
| 65 and above | 36% |
By Gender
The rate of single men and women in the U.S. is similar at 31%.
| Gender | % of Singles |
|---|---|
| Men | 31% |
| Women | 31% |
By Education
- 34% of single adults in the U.S. have completed their GED or High School Diploma, representing the highest number of singles who have attained this level of education.
- 32% of single adults in the U.S. pursued higher education but are yet to complete a bachelor’s degree.
- 25% of American singles have completed a Bachelor’s degree.
| Level Of Education | % of Singles |
|---|---|
| High School Diploma/GED or less | 34% |
| Some College | 32% |
| Bachelor’s degree | 25% |
Source: iusw.org, thrivingcenterofpsych.com, and Pewresearch.org.
How Many Are Looking For A Date
- 53% of singles on the dating market are looking for either casual dates or long-term relationships.
- 28% of singles on the dating market are looking for a long-term relationship only.
- 20% of singles on the dating market are looking for casual dates only.
- 36% of single women on the dating market are open to a committed relationship compared to 22% of men daters.
- 24% of older daters are looking for casual dates compared to 15% of younger daters.
- 25% of the widowed, separated, or divorced singles are looking for casual dates only.
- 17% of the never-married daters are looking for casual dates only
- 13% of those who are married or in a committed relationship are looking for casual dates.
- 52% of those who are married are open to casual dates or committed relationships.
- 24% of those who are married or in a committed relationship are looking for a relationship only.
Why Are People Single?
We’ve asked single people why they do not go on dates and here are the top 7 most used reasons:
| Reasons | Percentage |
|---|---|
| Have other important priorities | 47% |
| I am very busy | 20% |
| Bad luck in the past | 18% |
| Feeling nobody is interested | 17% |
| Not ready | 17% |
| Too old | 17% |
| Health issues | 11% |
Sources: thrivingcenterofpsych.com and iusw.org.
How Americans Feel About Being Single
- 31% are not content with being single.
- 69% are content with being single.
- 47% are afraid of being alone forever.
- 42% have felt judged for being single.
Fun facts
- 76% do not trust family and friends to set them up on blind dates.
- 53% said the more dates they go on, the more they love their pet.