
The American social terrain has undergone a dramatic shift in the last six decades, and as a result, so too have the traditional conduits of marriage and divorce. Far fewer Americans are getting married, and when they finally do decide to tie the knot, they are doing so later in life.
This trend has been met with a surge in divorce rates, and it coincides with the collision of changing and same-sex marriage, signaling that the country’s approach to the formation and dissolution of relationships has been broadened. Marriage Statistics for the USA serves as an insightful walk-through of these developments. Let’s take you through these statistics.
Table of Contents:
- How Many Get Married?
- How many Get Divorced?
- Average Length of Marriage
- Top Reasons for Why Couples Get Divorced?
- What Does It Cost to Get Divorced?
Major Findings
Marriage Statistics
- There were 2,065,905 marriages in the US in 2023, and the national marriage rate was 6.2 on a per 1,000-person basis.
- A marriage in the USA does on average last 8 years.
- 47.31% of all households in the USA had married couples
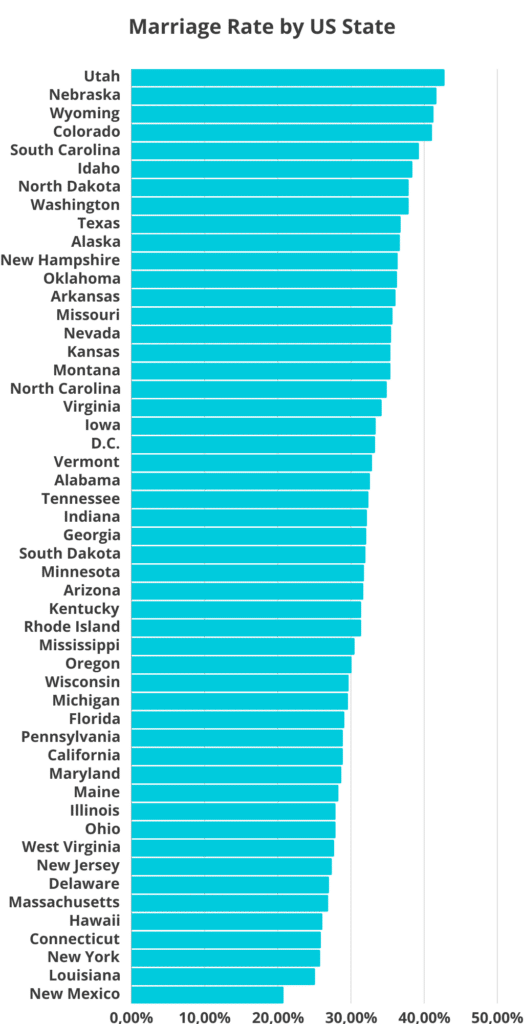
- The US States with the highest marriage rates are:
- Utah – 42.80% of women get married
- Nebraska – 41.70% of women get married
- Wyoming – 41.30% of women get married
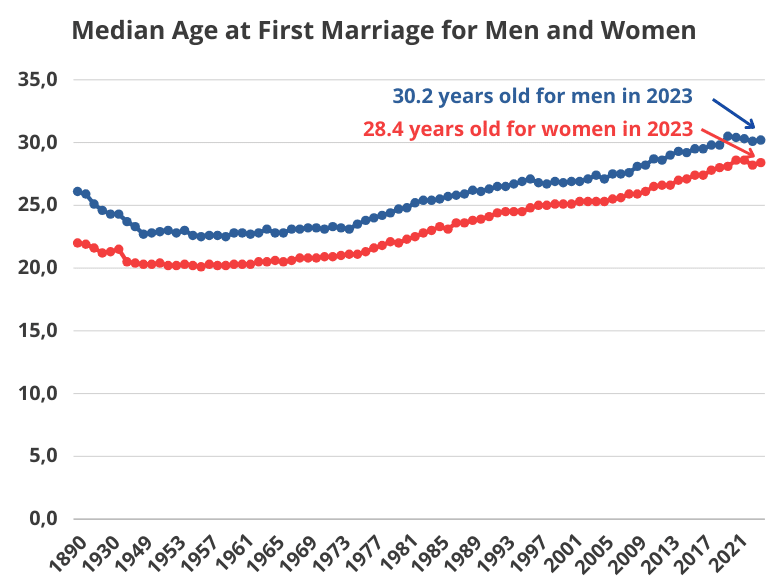
- Since 1890 people have been getting older and older when they first get married (median age 30.2 for men and 28.4 for women)
- Black men are the most likely to have never been married
- Millennials are marrying later and staying married longer, causing both marriage and divorce rates to drop.
Divorce Statistics:
- There were 689,308 divorces in the US in 2023, and the divorce rate was 2.4 on a per 1,000-population basis.
- Half of the first marriages end in divorce. Weeks after the wedding are the most divorce-prone time. The percentages are even higher for second (60%) and third (73%) marriages, with the likelihood of divorce decreasing with each transition.
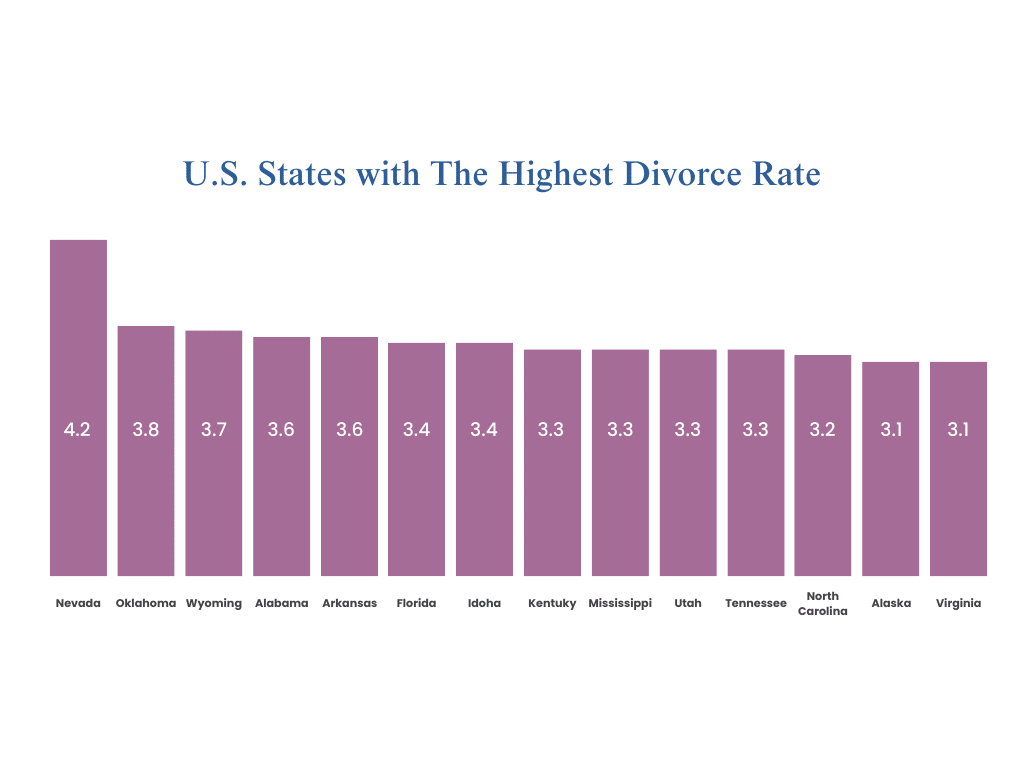
- The US States with the most divorces:
- Nevada – 4.2 divorces for every 1000 marriages.
- Oklahoma – 3.8 divorces for every 1000 marriages.
- Wyoming – 3.7 divorces for every 1000 marriages.
- As household income rises, divorce rates generally decrease, but intriguingly, they rebound at incomes above $600,000, indicating that high earnings can bring unique marital challenges.
- Marrying before 32 reduces divorce risk, with each year past 25 increasing it by 5%; however, rising median marriage ages—32 for men and 30 for women in 2022—reflect changing cultural norms and financial concerns, influencing these rates.
- In heterosexual marriages, women initiate 69% of divorces, often due to bearing the primary caregiving and emotional labor roles
- Higher divorce rates are observed in individuals with only high school education or less, while those with advanced degrees tend to have lower rates, indicating that higher education is linked with greater marital stability.
- Nearly 50% of U.S. marriages are expected to end in divorce or separation.
- The two biggest reasons why people get a divorce are: “lack of commitment” and “Infidelity or extramarital affairs”
- Couples spend typically around $7,000 to legally dissolve their marriage.
How Many Get Married?
- The number of Recorded Marriages as of 2023: 2,065,905.
- Marriage Rate as of 2023: 6.2 for every 1,000 people in the total population.
- In 1949, 78.8% of households contained married couples
- In 2023, only 47.31% of all households in the USA had married couples.
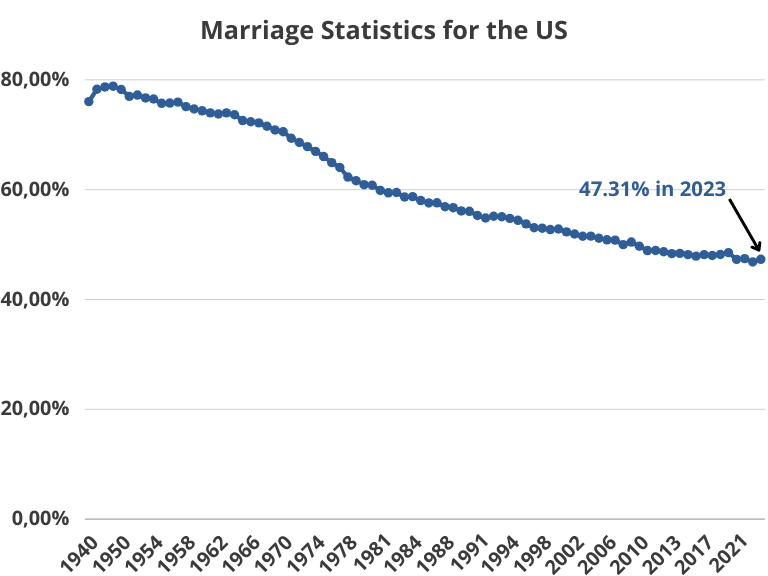
Find the dataset used for this graph here: https://docs.google.com/spreadsheets/d/1NnQEJgWEnLzZYX9L6wLellztmGJi-R2l8qi2X7S5fBg/edit?usp=sharing
By US State
- Utah Leads: Utah had the highest marriage rate, with nearly 43 marriages per 1,000 unmarried women.
- New Mexico at the Bottom: New Mexico recorded the lowest rate, with about 21 marriages per 1,000 unmarried women.
- Narrowing Gap: The highest and lowest state-level marriage rates were closer together compared to the year before, indicating a narrowing of differences across states.
Geographic Distribution
- Top Quartile States: States in the top quartile had at least 35.9 marriages per 1,000 unmarried women, well above the national average.
- Bottom Quartile States: States in the bottom quartile had 28.8 or fewer marriages per 1,000 unmarried women.
- Regional Trends:
- Western states mostly had high marriage rates.
- Midwestern states showed a mix, with North Dakota and Nebraska in the top quartile.
- Southern states largely fell in the third quartile.
- Northeastern states generally had lower marriage rates, except for New Hampshire, Vermont, and Rhode Island.
| US State | Marriage Rate | |
|---|---|---|
| 1 | Utah | 42.80% |
| 2 | Nebraska | 41.70% |
| 3 | Wyoming | 41.30% |
| 4 | Colorado | 41.10% |
| 5 | South Carolina | 39.30% |
| 6 | Idaho | 38.40% |
| 7 | North Dakota | 37.90% |
| 8 | Washington | 37.90% |
| 9 | Texas | 36.80% |
| 10 | Alaska | 36.70% |
| 11 | New Hampshire | 36.40% |
| 12 | Oklahoma | 36.30% |
| 13 | Arkansas | 36.10% |
| 14 | Missouri | 35.70% |
| 15 | Nevada | 35.50% |
| 16 | Kansas | 35.40% |
| 17 | Montana | 35.40% |
| 18 | North Carolina | 34.90% |
| 19 | Virginia | 34.20% |
| 20 | Iowa | 33.40% |
| 21 | D.C. | 33.30% |
| 22 | Vermont | 32.90% |
| 23 | Alabama | 32.60% |
| 24 | Tennessee | 32.40% |
| 25 | Indiana | 32.20% |
| 26 | Georgia | 32.10% |
| 27 | South Dakota | 32.00% |
| 28 | Minnesota | 31.80% |
| 29 | Arizona | 31.70% |
| 30 | Kentucky | 31.40% |
| 31 | Rhode Island | 31.40% |
| 32 | Mississippi | 30.50% |
| 33 | Oregon | 30.10% |
| 34 | Wisconsin | 29.70% |
| 35 | Michigan | 29.60% |
| 36 | Florida | 29.10% |
| 37 | Pennsylvania | 28.90% |
| 38 | California | 28.90% |
| 39 | Maryland | 28.70% |
| 40 | Maine | 28.30% |
| 41 | Illinois | 27.90% |
| 42 | Ohio | 27.90% |
| 43 | West Virginia | 27.70% |
| 44 | New Jersey | 27.40% |
| 45 | Delaware | 27.00% |
| 46 | Massachusetts | 26.90% |
| 47 | Hawaii | 26.10% |
| 48 | Connecticut | 25.90% |
| 49 | New York | 25.80% |
| 50 | Louisiana | 25.10% |
| 51 | New Mexico | 20.80% |
By Age
The age at which individuals first marry has significantly increased from 1890 to 2023, reflecting changes in societal norms, economic conditions, and personal priorities. In 1890, men typically married at 26.1 years and women at 22.0 years. This gap, indicative of the era’s societal expectations, began to close as the 20th century progressed.
Post-World War II saw a temporary decrease in these ages, with men marrying at 23.7 and women at 20.5 years in 1947. However, from the 1950s onward, a steady increase is observed. This rise aligns with societal shifts like the women’s liberation movement, greater access to education, and changing economic landscapes.
By the late 20th century, the trend towards later marriages became more pronounced. In 1990, the average age was 26.1 for men and 23.9 for women. This trend continued into the 21st century, influenced by factors such as career focus, higher education, and financial independence.
As of 2023, there’s a notable change: men’s average first marriage age is 30.2 years, and women’s is 28.4 years. This reflects a modern landscape where personal growth and financial stability are prioritized before marriage, showcasing the dynamic nature of societal structures and individual preferences in marital decisions.
| Year | Men’s Age at First Marriage | Women’s Age at First Marriage |
|---|---|---|
| 1890 | 26.1 | 22.0 |
| 1900 | 25.9 | 21.9 |
| 1910 | 25.1 | 21.6 |
| 1920 | 24.6 | 21.2 |
| 1930 | 24.3 | 21.3 |
| 1940 | 24.3 | 21.5 |
| 1947 | 23.7 | 20.5 |
| 1948 | 23.3 | 20.4 |
| 1949 | 22.7 | 20.3 |
| 1950 | 22.8 | 20.3 |
| 1951 | 22.9 | 20.4 |
| 1952 | 23.0 | 20.2 |
| 1953 | 22.8 | 20.2 |
| 1954 | 23.0 | 20.3 |
| 1955 | 22.6 | 20.2 |
| 1956 | 22.5 | 20.1 |
| 1957 | 22.6 | 20.3 |
| 1958 | 22.6 | 20.2 |
| 1959 | 22.5 | 20.2 |
| 1960 | 22.8 | 20.3 |
| 1961 | 22.8 | 20.3 |
| 1962 | 22.7 | 20.3 |
| 1963 | 22.8 | 20.5 |
| 1964 | 23.1 | 20.5 |
| 1965 | 22.8 | 20.6 |
| 1966 | 22.8 | 20.5 |
| 1967 | 23.1 | 20.6 |
| 1968 | 23.1 | 20.8 |
| 1969 | 23.2 | 20.8 |
| 1970 | 23.2 | 20.8 |
| 1971 | 23.1 | 20.9 |
| 1972 | 23.3 | 20.9 |
| 1973 | 23.2 | 21.0 |
| 1974 | 23.1 | 21.1 |
| 1975 | 23.5 | 21.1 |
| 1976 | 23.8 | 21.3 |
| 1977 | 24.0 | 21.6 |
| 1978 | 24.2 | 21.8 |
| 1979 | 24.4 | 22.1 |
| 1980 | 24.7 | 22.0 |
| 1981 | 24.8 | 22.3 |
| 1982 | 25.2 | 22.5 |
| 1983 | 25.4 | 22.8 |
| 1984 | 25.4 | 23.0 |
| 1985 | 25.5 | 23.3 |
| 1986 | 25.7 | 23.1 |
| 1987 | 25.8 | 23.6 |
| 1988 | 25.9 | 23.6 |
| 1989 | 26.2 | 23.8 |
| 1990 | 26.1 | 23.9 |
| 1991 | 26.3 | 24.1 |
| 1992 | 26.5 | 24.4 |
| 1993 | 26.5 | 24.5 |
| 1994 | 26.7 | 24.5 |
| 1995 | 26.9 | 24.5 |
| 1996 | 27.1 | 24.8 |
| 1997 | 26.8 | 25.0 |
| 1998 | 26.7 | 25.0 |
| 1999 | 26.9 | 25.1 |
| 2000 | 26.8 | 25.1 |
| 2001 | 26.9 | 25.1 |
| 2002 | 26.9 | 25.3 |
| 2003 | 27.1 | 25.3 |
| 2004 | 27.4 | 25.3 |
| 2005 | 27.1 | 25.3 |
| 2006 | 27.5 | 25.5 |
| 2007 | 27.5 | 25.6 |
| 2008 | 27.6 | 25.9 |
| 2009 | 28.1 | 25.9 |
| 2010 | 28.2 | 26.1 |
| 2011 | 28.7 | 26.5 |
| 2012 | 28.6 | 26.6 |
| 2013 | 29.0 | 26.6 |
| 2014 | 29.3 | 27.0 |
| 2015 | 29.2 | 27.1 |
| 2016 | 29.5 | 27.4 |
| 2017 | 29.5 | 27.4 |
| 2018 | 29.8 | 27.8 |
| 2019 | 29.8 | 28.0 |
| 2020 | 30.5 | 28.1 |
| 2021 | 30.4 | 28.6 |
| 2021 | 30.3 | 28.6 |
| 2022 | 30.1 | 28.2 |
| 2023 | 30.2 | 28.4 |
By Ethnicity
The marriage landscape in the United States has evolved significantly across different races and ethnicities. There has been a general decline in marriage rates among all racial and ethnic groups since 1990, with varying degrees of change.
- White Americans: The marriage rates for White Americans have fallen by approximately 7.6 percentage points since 1990.
- Black Americans: Black Americans have experienced an 8.4 percentage point drop in marriage rates. Notably, Black men are the most likely to have never been married, and Black women are less likely to be married compared to women of other demographics.
- Hispanic Americans: This group has seen an 11.1 percentage point decrease in marriage rates. Both Hispanic men and women have experienced significant increases in the percentage of individuals who have never been married.
- Asian Americans: Interestingly, the marriage rates for Asian Americans have remained relatively stable at around 61% since 1990.
This highlights that the shift in marriage rates is more pronounced among Black and Hispanic populations. For example, the percentage of Black men who have never been married rose from 43% in 1990 to 52% in 2022. Similarly, the percentage of Black women who have never been married increased from 37% to 49% during the same period. For Hispanic women, the increase was from 27% to 39%, and for Hispanic men, from 37% to 46%.
How many Get Divorced?
- In 2023, 673,989 divorces were documented in 45 reporting states in the U.S.
- The divorce rate is 2,4 per 1,000 people.
- Around half of all married couples end in divorce.
By US State
- Nevada possesses the highest rate of divorce in the U.S., with 4.2 divorces for every 1,000 marriages.
- This may be due in part to the considerably relaxed regulations concerning the processes for marriage and divorce within the state.
- The lowest rate exists in Massachusetts, with merely 1 divorce for every 1,000 marriages.
- Massachusetts’s statistics of marrying at an older age demonstrate one of the reasons for the low divorce rates in the state, with age potentially serving as a factor for their marriage longevity.
By Occupation
This data presents an interesting insight into the relationship between occupation and divorce rates. A few observations and possible interpretations:
High-Stress Occupations: Many of the occupations listed, such as flight attendants, nurses, and factory workers, are known to involve high levels of stress. Stress can strain personal relationships, potentially leading to higher divorce rates.
Irregular Hours: Occupations like bartenders, flight attendants, and nurses often require working during evenings, nights, or weekends. This irregular schedule can disrupt family life and make it challenging to maintain a stable relationship.
Social Environments: Jobs like bartending and being a flight attendant involve constant interaction with a wide range of people, which might increase the likelihood of encountering relationship-testing situations.
Economic Factors: Some of these occupations, particularly in the service sector (like telemarketers or textile machine operators), might not offer high wages or job security. Financial strain is a well-documented factor contributing to marital discord.
Physical and Emotional Demands: Jobs involving physical labor (like roofing) or emotional labor (like psychiatric nursing) can be draining, leaving individuals with less energy for their personal lives.
Nature of the Work: In some cases, the nature of the work itself might influence relationship dynamics. For instance, dancers and choreographers often work in environments where physical expression and connectivity are integral, which could impact personal relationships outside of work.
It’s important to note that while these factors might contribute to the higher divorce rates observed in these occupations, they don’t necessarily cause divorce. Relationships are complex and influenced by a multitude of factors, both personal and professional. Additionally, this data should be interpreted cautiously as it doesn’t capture all nuances and variables involved in marital stability.
| Occupation | Divorce Rate (in %) |
|---|---|
| Gaming Manager | 52.9% |
| Bartender | 52.7% |
| Flight Attendant | 50.5% |
| Gaming Service Workers | 50.3% |
| Rolling Machine Setters | 50.1% |
| Switchboard Operators | 49.7% |
| Extruding and drawing machine setters | 49.6% |
| Telemarketers | 49.2% |
| Textile Machine Operators | 48.9% |
| Compacting Machine-setters, operators, and tenders | 48.8% |
By Income
- Couples with lower incomes often have higher divorce rates, with rates decreasing significantly as incomes begin to rise.
- Divorce rates tend to drop from 40% to 30% for those with a household income of around $200,000. After that point, divorce rates remain flat at 30% and continue to decrease to about 25% at an income level of $600,000.
- Intriguingly, once incomes go above the $600,000 mark, the divorce rate goes back up to 30%, suggesting that very high incomes can bring their own set of marital challenges.
- Financial strain at the poverty level is associated with a trash-hold divorce rate of 46%, with individuals from 18 to 55 below the poverty level reporting that they had been divorced.
- Men and women not in the labor force have a similar divorce rate, with 21% of men and 22% of women not working as they are undergoing a divorce.
By Age
- Marrying before 32 cuts divorce rates. The risk of divorce is reduced by 50% if you marry at 25 as opposed to 20. Getting married after that led to a 5% hike in divorce rates each year.
- The average age at divorce rose to 46 for men and 44 for women in 2022, further illustrating a tendency for divorce to creep up with age.
- Median age at first marriage has been steadily soaring, hitting 32 for men and 30 for women in 2022.
- This delay, regularly caused by financial concerns or a change in cultural customs, might comfortably influence divorce rates.
- Divorce rates have been rising for Baby Boomers as they begin retiring from their jobs. The trend shows 46% of people 55 to 64 yrs., 39% 65 to 75 yrs. And 24% of those 75 and over get divorced.
By Gender
- Women initiated an overwhelming 69% of divorces in heterosexual marriages. This points to some significant gender disparities in who chooses to dissolve a marriage.
- Being the primary caregiver and taking on the brunt of the emotional labor in relationships compel women to make these decisions.
- There were 7.6 divorces per 1,000 women aged 15 and older in 2019, showing a decline from 9.7 per 1,000 in 2009.
By Ethnicity
- White couples clock in at a divorce rate of 15.1% alongside a marriage rate of 32.1%, indicating a fair amount of stability in marital unions.
- The black divorce rate currently sits at a heavy 30.8% and pairs with a marriage rate of 17.3%, indicating significant challenges and disparities.
- Hispanic couples hold a divorce rate of 18.5% and an impressive 33.2% marriage rate. This is the highest of the groups and shows that marriage is taken very seriously, with a side order of divorce.
Read more about interracial marriage and divorces here.
By Education
- For men and women with a high school education or less, divorce rates were 39% and 37%, respectively, indicating a higher risk of divorce among those with lower levels of formal education.
- Men and women with education beyond a bachelor’s degree showed lower divorce rates, at 26% for men and 30% for women. It appears that higher education is associated with more marital stability.
- College-educated women were more likely to enjoy marital longevity.
- 78% of them will keep their marriage going for at least 20 years versus 49% of those with some college and 40% of those with a high school education or less.
By Religion
- Among Hindus, 60% are married, but only 5% are divorced. Hindus thus boast the religion with the lowest divorce rate, signaling a significant degree of marital stability in the community.
- Evangelical Protestants carry the highest divorce rates among the religious groups discussed, with 55% married and 14% divorced.
- Those unaffiliated with a religion wield an 11% divorce rate alongside a lower marriage rate of 37%, meaning that those without religious affiliation are more likely to divorce.
Average Length of Marriage
- The Average Length of Marriage in the US is typically 8 years. Divorce rates and the duration of marriages in the U.S. vary from state to state.
- The lengths of time for which people are married vary broadly across countries globally. It ranges from an average of 18 years in Italy to under five years in Qatar, reflecting its high divorce rate.
- Subsequent marriages have higher rates of divorce, with 67% of second marriages and 73% of third marriages ending in divorce. It shows an increase in the likelihood of divorce with further marriages
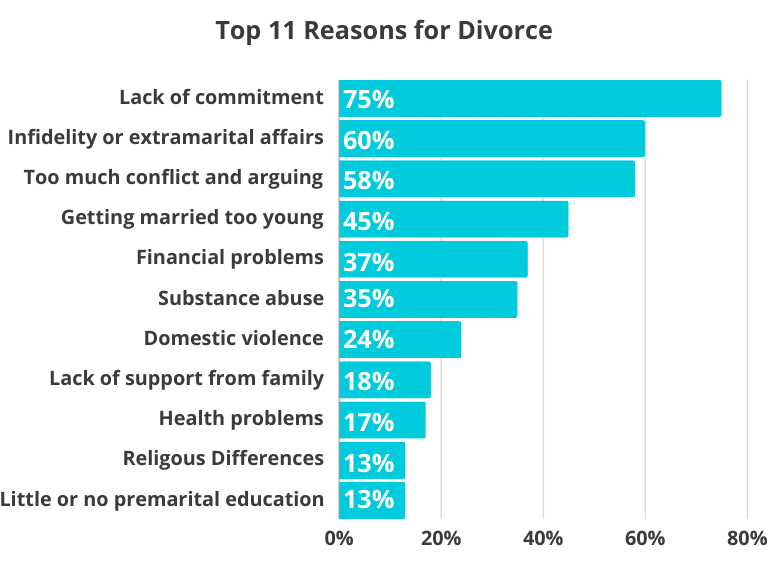
Top Reasons for Why Couples Get Divorced?
- 75% cited “lack of commitment” as the reason for their divorce.
- 60% said “Infidelity or extramarital affairs” were the reason for their divorce.
- 58% said “too much conflict and arguing”
- 45% said it was because they “got married too young”
- 37% said “financial problems”
- 35% said “substance abuse”
- 24% mentioned “domestic violence” as the primary reason
- 18% said “lack of support from family”
- 17% mentioned “Health problems”
- 13% said “religious differences”
- and 13% said “little or no premarital education”
What Does It Cost to Get Divorced?
- The length of a divorce process, measured from the time of filing to the finalization, allows contested divorces to extend one year or more generally. Some cases take less time and can conclude in roughly three months.
- It’s not uncommon for a couple to spend an estimated $7,000 during the process of legally severing their marital ties, underscoring a substantial financial impact. The divorce industry is expected to be worth around $55 billion.
- In the aftermath of a divorce, countless individuals opt to remarry. With 64% of men and 52% of women retying the knot, this speaks to abiding faith in the institution despite the dissolution of their previous union.
Sources: Forbes.com, Brides.com, Cdc.gov, Usafacts.org, Bgsu.edu, and Census.gov.